In the particle in a box active physics much was learned visually about the abstract world of modern physics. The two varying factors are the length and the mass. There are two wave functions that are simply psi and psi squared. Psi squared also actually equals the probability of the chance that particle is within a certain area.
The graphs also show a different value for the value of n which, the probability of finding the particle in that area is much higher as the values of n rise. As the length increases and decreases there are many changes that occur to these probabilities. The longest wavelength with a standing wave L is on that goes to twenty times ten to the negative fifteenth meters and the mass at the minimum must be 1.0 times the mass of a proton.
This is the energy of the ground state this can also be written as E = h^2/8mL this is the equation derived and given for an atom in ground state for a particle in a box. As the length of the box in this denoted as L increases then the value of the energy is decreased. It is inversely proportional to the ground state energy of an atom.
In this photo the value of the length of the standing waves has not been changed however the mass has been increased. Instead of being only the mass of one proton, the mass is now increased to five protons. This value makes the energy much lower. When the energy levels are higher the amount of energy is not nearly as high as any of the other energies as the mass is increased. Basically the higher the mass the lower the energy weirdly.
Monday, December 12, 2011
Friday, December 9, 2011
Active Physics Relativity
The active physics relativity gave a much more visual perspective of relativity. This included time dilation as well as length contraction. The field of simultaneity also applies which shows and proves that time is relative; depending on what frame of reference is given, each person has a different perspective on how fast something is traveling, the time it takes to reach that person and the contraction of the length given.
A time clock is given and it shows the time dilation when one is moving. If the value of gamma is higher, the time dilation is greater. This theory shows the effects of time travel that man has been forever struggling to do. This effect of time dilation has been proven in a way. Active physics is a great way to visually understand the effects of relativity.
The distance of the light travel is relative to how fast the movement of the frame is, however this only works at very high speeds and that any nonrelativistic speeds, this theory will not work. There are also many interesting things that happen at relativistic speeds such as the relativistic momentum and relativistic mass all depends on what frame on is in.
Relativity is basically just like a non relativistic depiction however whatever is the previous value of the time dilation and length contraction is just multiplied by gamma to find the change in time or length or even momentum. In the length contraction, the varying factor in the visual program is the length. When it shows that the length increases by a certain amount, then the time it takes for one light to get to the end increases giving the length a certain amount will be contracted.
Planck's Constant from an LED
In this experiment, the value of Planck's constant is to be measured using the wavelength of the different colors of the spectra. The theoretical value of Planck's constant is h = 6.626*10^-34 J s, but hopefully the actual value will be very close to that. There are several things that have been done in previous labs that will be used on this lab. The same setup as done with the color and spectra lab using 2 meter and 1 meter sticks to determine the wavelength of a given color. However, this time a different color light is given.
A diode is used in this laboratory which makes sure that the current does not flow in a seperate direction. There were four colors being tested and the voltage was given: red 1.87V, green 2.51V, Blue 2.62V, Yellow 1.89V. Using the equations Energy = charge of electron X voltage, and E= hc/lambda, E = -A/n^2, the wavelengths were calculated. Another measured distance was the distance from the light bulb to the color spectra. These were blue was twenty five centimeters, green 30 cm, red 37.5 cm, yellow 34 cm.
After many algebraic and geometric equations the values of planck's constant were fairly close to the calculated values. Values of 6.53 * 10^-34, 6.36 * 10^-34, and other values close to those values. However, like any other laboratory experiment there are possibilities of uncertainty. No matter how far one can measure something to, there will always be some value of uncertainty.
Human error in this lab is very high because it must be done with two people, making it harder to clarify what one sees. Of course, there is uncertainty in the other measurements as well such as the distance of the length from the LED to the diffraction grating.
Monday, November 28, 2011
Python Wave Function
This lab was a much different lab in all the rest because it required the use of computer programming using the language of phython. The ultimate goal or objective of this experiment is simply stated in the title. This allows students to be easier to visualize and see what is really going on to the uncertainty principle and how it relates to their construction. The programs that were used in this laboratory experiment was python, vpyton and pylab were to be installed prior to starting the lab.
Particles that are in a definite energy state like an electron bound which is not in an infinite energy level in an atom. The value of the absolute value of psi squared is independent of time, which is called a stationary state. If the definite energy E and the time dependent wave function can be written as a product of the time independent function and a function of time. The Schrodinger equation for a particle with definite energy E is:
Treating the wave function as a separable differential function, it can be seperated into a part that depends on x and one that depends on time. Taking the partial derivative with respect to time and the space portion constant comes out in front, this can be plugged back into the schrodinger equation and then divide both sides by psi of x times f of time. Rearrangement and cleaning up allows
The plot of a Gaussian distribution is one of the tasks for this assignment. In the informal form of psuedocode, the mean average and the standard deviation is set as constant, which is the followed by the coefficient of one over sigma root 2 pi. An initialized list called Gauss was then created and the function for gauss was coeff*e^-(x-avg)^2/2sigma^2. The final step was to write plot(x,Gauss). A graph that had a bell curve was then shown. This really shows that the probability that the particle is in a certain region gets much larger at a certain point and gets less and less at all other parts.
Another step or objective from this lab was to plot a sinusoidal function instead of a bell curve. This is surprisingly not that much more difficult, however it does require that some adjustments are made not only to the equation being used, but also to the boundaries of the sinusoid. The bounds used in this particular lab were set between the values of positive and negative pi. The program was also designed so that the amplitude and period of the sine function can be varied. This is accomplished by defining the variable of the amplitude. The frequency coefficient was also defined with a loop so that it could repeat itself to get a better view of whats going on.
The experiment was a different approach at tackling labs and understanding concepts because the probability of finding the particle and actually finding the particle cannot be determined using lab equipment found in community colleges. This laboratory may have been frustrating for some at first but once one gets the hang of it, it is not really that bad. Graphs of any type can be accomplished plotted and varied from any view. There is really no uncertainty in this lab which is one of the few labs like that. The only uncertainty is being uncertain that the program will work correctly.
Color and Spectra
Even though the experiment consisted of fairly simple materials, it produced interesting results.It was set up using a two meter stick a lamp and a one meter stick. The meter sticks were placed at 90 degree angles. They were stood up and used grating holders and the spectrum was measured. The glass or plastic slit that diffracts light used two slits of grating and it was placed at the end of the two meter stick.
Two triangles can be created using the wavelength, length of the distance of the diffractive glass to the light bulb and the distance calculated for each given color. When the eye moves outward from the center, light reaching it at a point along that color that was needed to be found gives the length d. For two similar triangles the ratio of equivalent sides of the two triangles are equal to one another.
As we measured each wavelength the purple was 393 nanometers, blue 446 nm, green 506 nm, yellow 507 nm, and red was 644 nm. There is a lot of uncertainty with these numbers because it is quite difficult to determine the exact location of the color spectra. This lab definitely requires at least two people to completely get done otherwise one cannot determine the location of distance from the light source to the designated color.
In the five thousand volt terminals of the power supply, the gas that was measured was mercury as the hidden gas. The lengths from the distance of the color from the light source was purple at 48 cm, green at 61 cm, yellow at 65 cm, red at 78 cm. Again these came to around values of 446, 515, 556, 588 nanometers which is in a fairly linear scale like it should be. There is a lot of uncertainty however because again human error makes a fairly large difference in the wavelength of the given color.
Friday, October 7, 2011
Experiment 10: Lenses
The objective of this experiment is to determine a relationship between the object distance d0, the image distance di, and the image height hi. This can be accomplished by increasing the focal length by an integer value each trial. The first step that must be done is to determine the focal length of the magnifying glass that is being used. This can be determined by taking the convex lense outside where the sun is and continue adjusting the length until the focal length can be determined. Measure this using a ruler and the focal length for the lense was 24.5 cm.
As the object distance is changed to half the focal length, the focal point could not be seen because the image was blurry and cannot be focused on. Graphs were to be plotted with the object distance vs the image distance with the object distance on the x values and the image distance on the y values.
This is not a linear graph but the graph of the inverse is more linear:
Using the computer's best line fit for the equation, the resulting line is y = -.87337x + .03788 which determines a lot about the graph of the inverses. The y intercept of .03788 determines the inverse of the focal length which is simply just 1/y intercept. The slope of the line indicates the relation of the focal point and the object distance. In the form of y = mx + b, the actual equation becomes 1/p = -m(1/q) + 1/f.
Just like any other experiment, there is always a certain amount of uncertainty. Especially with this lab and the lab where the width of a human hair is measured, slight uncertainty results can result in a much larger field of error. The most obvious uncertainty in this experiment comes from the human error. When the focal length was measured outside when using the sun as a source of light, many factors can contribute in giving an inaccurate measurement. However, the trial is done twice to minimize the amount of error given off by measurements. The other factor of uncertainty is basically the same thing, when one measures with the ruler, the measurements will always become off by a small but damaging amount.
Monday, October 3, 2011
Experiment 9: Concave and Convex Mirrors
This experiment contains very few materials since it is more of a conceptual lab. Most of the lab is done by just observations, and then applying those observations with the geometric drawing to determine whethere they agree with each other. The equipment or materials needed for this lab are simple: obviously a convex and concave mirror, a ruler, and an object. There are two main parts for each the convex and concave mirror. The first part consists of writing observations of how the mirrors play a role in the reflection of light waves, and secondly to determine the trigonometric angles to determine the height of the image and the magnification using scaling techniques.
The first part of the two mirrors is a convex mirror, which is a mirror that is rounded outward rather than inward. Any object will suffice such as my hand, and thus using this object in front of the convex mirror, the image appears larger in the middle, but smaller on the outside. The image on the mirror is upright rather than inverted. The image is located closer relative to the position of the mirror and object. As one moves the object closer to the mirror, the new image gets much larger fairly quickly. Likewise, as one moves the object further form the mirror than the previous observations, the new image gets much smaller quickly.
The second part of the convex mirror part is to determine the magnification of an image using simple geometric ways. The drawing above is basically recreated and the magnification is to be determined. The definition of magnification is the height of the image divided by the height of the object. The magnification of this convex mirror is .8cm / 3.3 cm which came out to be about .24x magnification. The observations did agree with the light ray sketch because the magnification is smaller.
For the concave mirrors, things are a little bit different than in the convex mirrors. Concave just means a mirror that is bent inward rather than outward which seems sort of like a cave hence the name. The image appears larger than the object instead of smaller like the convex because of the different ways the light reflects off the surface. The image also appears inverted from far, but upright from close. This must be because the focal point is in front of the mirror, rather than behind. So once the focal point is passed, the image becomes inverted. The image is located farther relative to the position of the mirror and object, whereas in convex it was the opposite.
After the observations of the concave mirror have been made, it is time to start the geometric applications of the light to this mirror. Just like how it was done for the convex mirror, a ruler will be used to show the reflection of the light rays bouncing off the surface of the mirror. The ruler is used to measure the distance of the object, the height of the object, the distance of the image, and the height of the image. In the end, the only two needed variables are the height of the image and the height of the object which are divided by each other to get a magnification of -.26x. This is nearly the same but negative as the magnification of the convex mirror. In a world without uncertainty, these would be exactly opposite values, but however due to human error and the thickness of the lead in a pencil, these will contribute factors of uncertainty. Even though they are minor and may be neglected, these are the only uncertainties that this lab will have.
Tuesday, September 27, 2011
Experiment 7: Introduction to Reflection and Refraction
The equipment needed for this experiment is fairly limited considering other experiments which require many different objects, fluids, logger pro, etc. The only equipment needed for this experiment is a light box or laser, a semicircular plastic or glass prism, and a circular protractor. The semi circular prism is used for this laboratory because the shape provides a convenient mathematical purpose. A light ray traveling in the plastic which starts or ends at the midpoint of the flat side is traveling along the radius of the circle, which gives a constant continuous distance from the curved edge to the straight edge.
As can be seen, this lab is does not require a significant amount of work to setup, the only thing that may be of frustration is the fact that the protractor may move when the light box is placed over it. However, this can be corrected by simply putting any form of tape on the sides to allow it to not move.
This is the result for the first trial which gives angles of incidence at intervals of exactly ten degrees each time. The maximum angle of incidence in this trial is 80 degrees because 90 degrees will give an angle of refraction of zero because it will be vertical to the glass prism. The graph of this trial using the angle of incidence and the angle of refraction is:
As it can be seen, the relationship is nearly linear, but obviously it is not perfectly linear due to several slight errors, one of which may be human errors and inability to decipher exactly which angle the light is passing through. The uncertainty for each of the angles is probably +- 2 degrees or so at maximum. There are also other errors that may be difficult to determine such as the error on the protractor. Every ruler and protractor will have some uncertainty on it just like the volume labels in a volumetric flask. These however are fairly minimal, and may only alter the results only slightly.
Normally the angle of incidence should keep increasing by ten degrees until the 80th degree. However the angle could not reach that degree because there will be no more light shining through for refraction. The light could not be seen and therefore the angle will stop at that point. The refraction cannot be seen because it is too refracted. All in all the experiment was a success and gives many details about the properties of light. The slope of the graph of the first trial was .648 when using the linear fit line for the graph. The angle of incidence when hitting a reflective device such as a mirror equals the angle of reflection but the angle of refraction is given by a different formula which depends on the index of refraction of the material and also the index of refraction of the air, or whichever outer substance is outside.
Tuesday, September 13, 2011
Experiment 4: Standing Waves
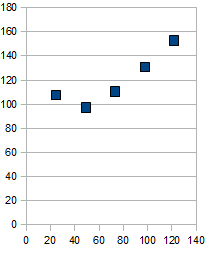
The objective of this experiment is to gain knowledge and understanding of standing waves driven by an external force. There are several items that must be obtained before the experiment may be executed. These such items are a Pasco Variable Frequency Wave Driver, a weight which will be calculated using the mass, a meter stick for measuring the length of the string, a pulley and a pendulum clamp.
The main idea behind this entire lab is to find a relationship between the amount of nodes and antinodes, and as well as the frequency given by these nodes. It is clear to see that a higher frequency will create more nodes and antinodes.
Nodes Hz
2 17
3 32
4 51
5 71
6 86
7 104
8 122
9 140
10 158
11 177
This was used with a 123 centimeter string and clearly shows that the frequency increases as the nodes and anti nodes increase. There will always be one more node than antinode on any given wave.
Velocity = Frequency X Wavelength
Wavelength = 2(Length) / n
Velocity = sqrt(Tension / mass per unit length)
Wavelength = 2(Length) / n
Velocity = sqrt(Tension / mass per unit length)
The tension in the string was calculated by simply determining the weight on it which in this case was 200.2 grams multiplied by the downward force of gravity at 9.8 m/s^2. The weight of the rope was determined by putting a set amount of length on the scale and then multiplying it by the length to determine how much the weight of the string was.
Monday, September 5, 2011
Experiment 2: Fluid Dynamics
A bucket filled with water to a height h has a blocked hole on the bottom. The measurements of both the height h and the height of the hole from the bottom of the bucket is measured. Taking th difference between these two measurements gives the height of the hole to the surface of water. Measuring as accurately as possible, the height h is 13.6 cm and the height from the bottom is 2.5 cm both with an uncertainty of +- .05 cm giving the height from the hole to the surface of the water as 11.1 cm +- .10 cm. The diameter of the hole is measured again as accurately as possible giving a value of .55 cm +- .05 cm. The area of that hole can then be calculated by taking half the diameter, squaring it, then multiplying by pi.
The volume emptied chosen was to 400 mL of water which was then measured by a beaker. 6 trials were done in measuring the time needed to empty the 400 mL of water and they came out to 15.9, 13.32, 12.45, 12.65, 12.61, and 13.39 seconds. Due to human errors and reaction time the uncertainty of each of these time intervals was +- 0.15 seconds. The average time of these six trials was calculated as 13.39 +- 2.02 seconds.
Using the volume emptied 400 mL, area of drain hole 2.38 * 10^-5 m/s, acceleration due to gravity 9.8 m/s/s, and height of water 11.1 cm, the theoretical time taken given by:
The theoretical time was calculated to be 11.41 seconds. The difference between actual and theoretical values were all between 1.20 and 4.49 seconds, but the 4.49 seconds deviates greatly from the rest and is an outlier. Calculating the percent errors on the times between actual and theoretical values came to be 39%, 16%, 9.1%, 10.8%, 10.5%, and 15.6%. This was given by the universal formula of error percent:
Even using the values of uncertainty, the experimental values did not agree with the theoretical values entirely. All the time difference errors were near 1 to 4 seconds uncertainty did not calculate to be that great. To correct this problem a greater value of uncertainty should be estimated. Fluid experiments seem to have larger uncertainty than some branches of physics because the exact volume measured is more difficult to catch precisely. Other main uncertainties come from reaction time of starting the stopwatch and stopping it since this requires two people. The biggest form of uncertainty comes from the inaccurate volume measurement since water is flowing fairly quickly and it is less obvious to tell what the volume is precisely. The beaker itself has an uncertainty when filling up because of how precise the beaker is constructed. Many beakers, graduated cylinders, and other glassware contain an uncertainty and it is printed on the glassware. For example 500 mL +-.5 mL.
Wednesday, August 31, 2011
Experiment 1: Fluid Statics
The determination of the weight of the metal cylinder in air was the first step and the weight of it completely submerged in water was the second. It weighed 200g +-1g in the air and 1.75 +- .2 N in the water. After drawing a free body diagram of the cylinder, the bouyant force and tension added together must equal the weight mg. The tension was measured using the force probe and the weight was already measured giving the bouyant force in terms of the weight of the cylinder and the tension in the string as
B = mg - T
The bouyant force was then calculated to be .212 N. The second method uses Archimede's principle to calculate the bouyant force which is equal to the weight of the displaced water. The bouyant force equals .438 Newtons. The third method uses the volume of the cylinder to determine the volume of the displaced water. Measurements of the height and diameter of the cylinder are taken and the formula for volume of a cylinder must be known as well.
Density(Volume)gravity = Mass(gravity)
The density of water is 1000 kg/ m^3 giving the bouyant force equal to .313 Newtons. For the three values of buoyant force, the results were .212N, .438N, .313N +- .3 N. Uncertainties arise from human error of measurements especially with measuring the mass of the cylinder and water. Other uncertainties arise from the water not 100% overflowing into the overflow cup. The most accurate would probably be the first method, because there is less uncertainties. The overflow method is slightly estimated since some water does still stay on the side. In part A, if the cylinder had been touching the bottom of the water container, the values for the buoyant force would not be accurate since it would not be completely acted on by buoyant force. If it was touching the bottom, the value for buoyant force would be lower.
Subscribe to:
Posts (Atom)